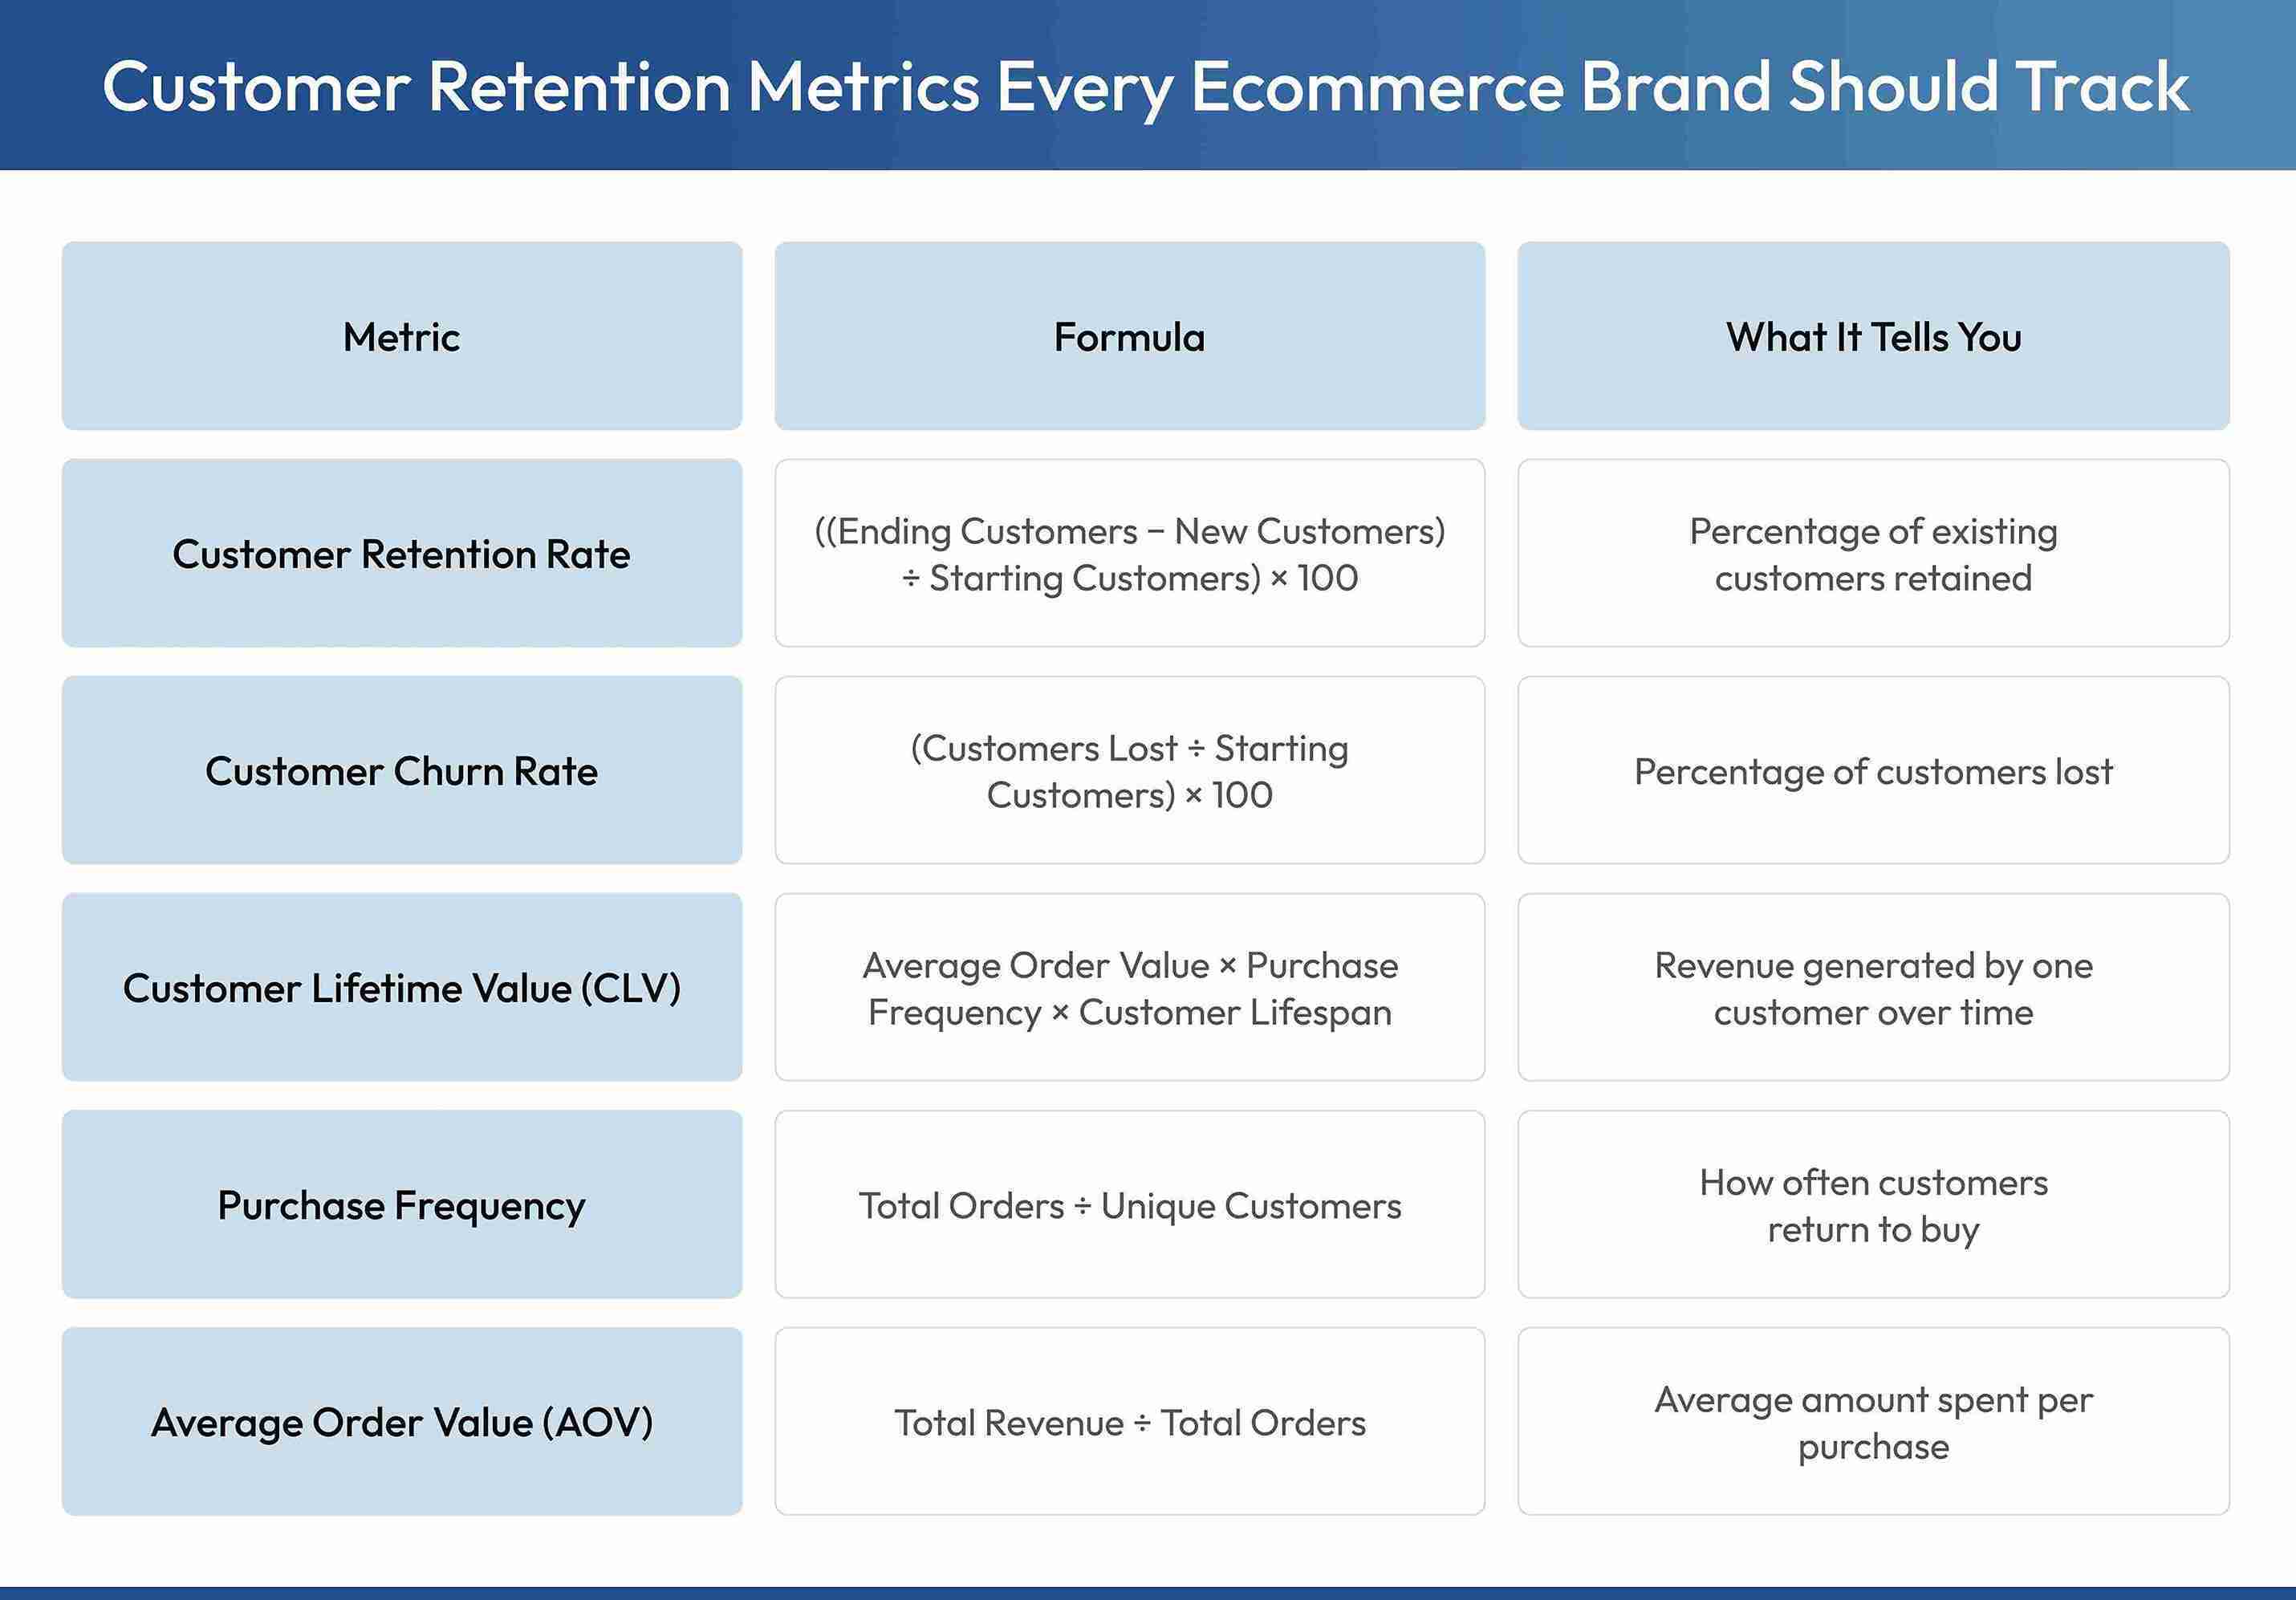
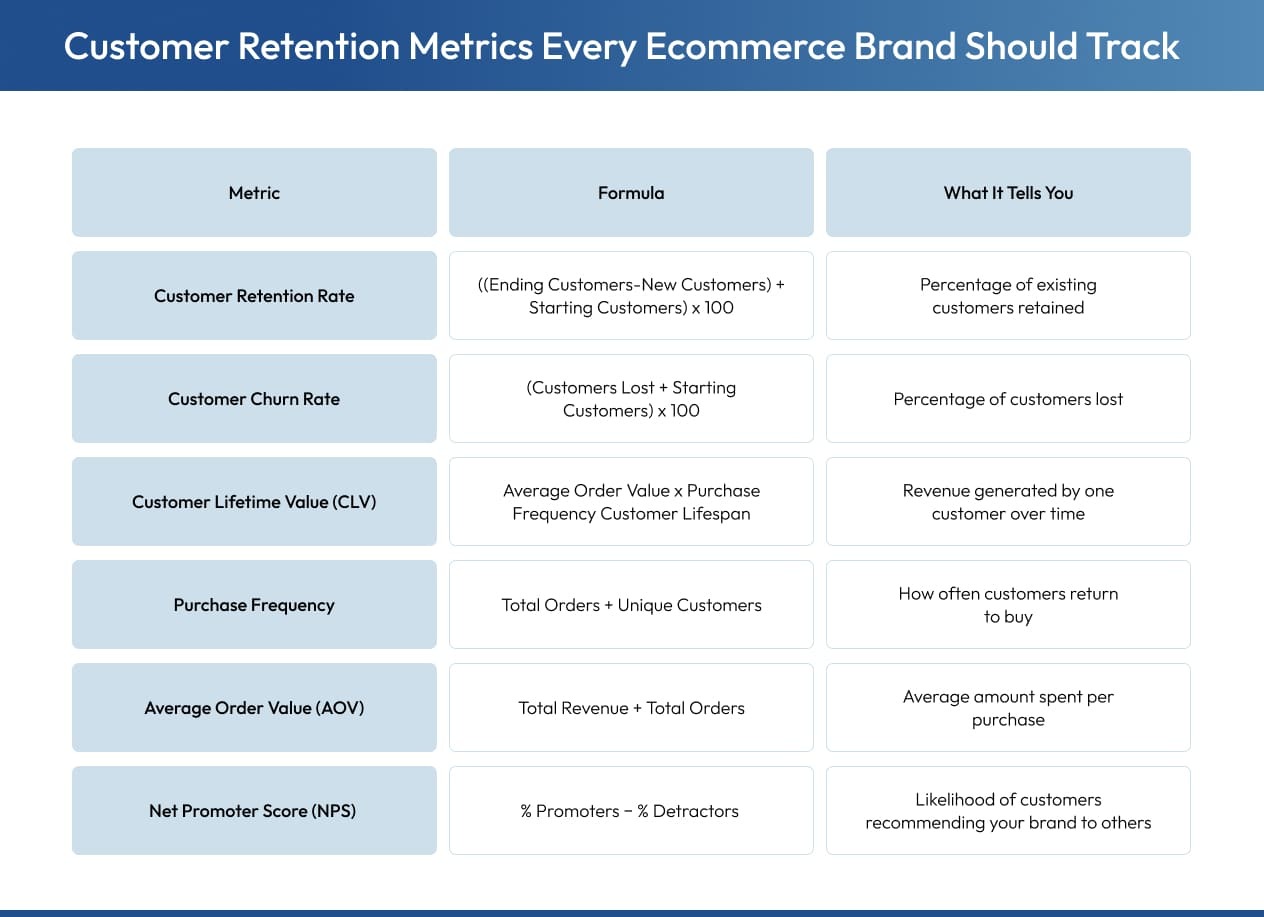
Your retention rate gives you the “what”. These four metrics give you the why and the how much. Together they help you identify exactly where your retention strategy is strong, where it's leaking, and where the biggest revenue opportunity sits.
1. Customer Churn Rate
Churn is the direct opposite of retention. While your retention rate shows who stayed, churn rate shows who left and how fast. A rising churn rate is an early warning signal that something in the customer experience has broken down, whether that is a poor post-purchase flow, a product quality issue, or a gap in communication after the first order.
Formula: (Customers lost during period ÷ Customers at start of period) × 100
Example: You started the month with 1,000 customers and lost 60.
(60 ÷ 1,000) × 100 = 6% churn rate
Always track churn alongside retention so you know which direction your customer base is actually moving, not just how many stayed.
Customer Lifetime Value (CLV)
CLV is the total revenue you can expect from a single customer over their entire relationship with your brand. It is one of the most important numbers in ecommerce because it determines how much you can justify spending to acquire a customer in the first place, and how much each percentage point of improved retention is actually worth.
Formula: Average order value × Purchase frequency × Average customer lifespan
Example: A customer spends ₹1,500 per order, buys 4 times a year, and stays with your brand for 2 years.
₹1,500 × 4 × 2 = ₹12,000 CLV
When retention improves, CLV goes up automatically. Customers who stay longer and buy more often are worth significantly more than one-time buyers, which is why even a small lift in retention rate can have an outsized impact on total revenue.
3. Purchase Frequency
Purchase frequency measures how often your retained customers return to buy within a set period. A high retention rate paired with low purchase frequency means customers are technically staying but not buying which limits the revenue impact of your retention work.
Formula: Total number of orders ÷ Number of unique customers
Example: Your store recorded 1,800 orders from 600 unique customers last month.
1,800 ÷ 600 = 3 purchases per customer
Tracking this over time tells you whether your loyalty programs, replenishment reminders, and re-engagement campaigns are actually driving return visits, or just delaying cancellations. For consumable products especially, purchase frequency is one of the clearest indicators of whether your retention engine is working as intended.
4. Average Order Value (AOV)
AOV measures how much customers spend per transaction. In the context of retention, it answers a specific question: are your loyal customers spending more over time, or are they returning only for small, low-margin repeat purchases?
Formula: Total revenue ÷ Total number of orders
Example: Your store generated ₹5,00,000 in revenue from 1,000 orders last month.
₹5,00,000 ÷ 1,000 = ₹500 AOV
Retained customers typically have a higher AOV than first-time buyers because they already trust the brand and need less convincing at checkout. If your AOV is flat or declining among repeat buyers, it is a signal to revisit your upsell and cross-sell strategy, product recommendations, bundle offers, and loyalty tier incentives; all directly influence this number.
5. Net Promoter Score (NPS)
Net Promoter Score (NPS) measures how likely your customers are to recommend your brand to someone else, on a scale of 0 to 10. It works alongside retention rate as a leading indicator, because customers who would recommend you are usually the same customers who keep buying from you.
Formula: % Promoters (score 9–10) − % Detractors (score 0–6)
Example: You survey 500 customers. 300 rate you 9 or 10 (60% promoters) and 75 rate you 0 to 6 (15% detractors).
60% − 15% = 45 NPS
A score above 30 is considered good, and above 70 is considered excellent. A strong NPS signals your retention efforts are creating real advocates, not just repeat transactions, which is what fuels the organic referral growth covered later in this guide.

 19 Aug 2026
 31 Min Read
_1783326713.jpeg)

_1785494390.jpg)


_1790076136.png)